A few weeks back, in making the case for investing in shares for the long term, I wrote:
“The reason that I am a fan of adopting a buy and hold approach is that the primary compromise that we will have to make (sitting through inevitable periods of temporary drawdown) is well known and understood in advance.”
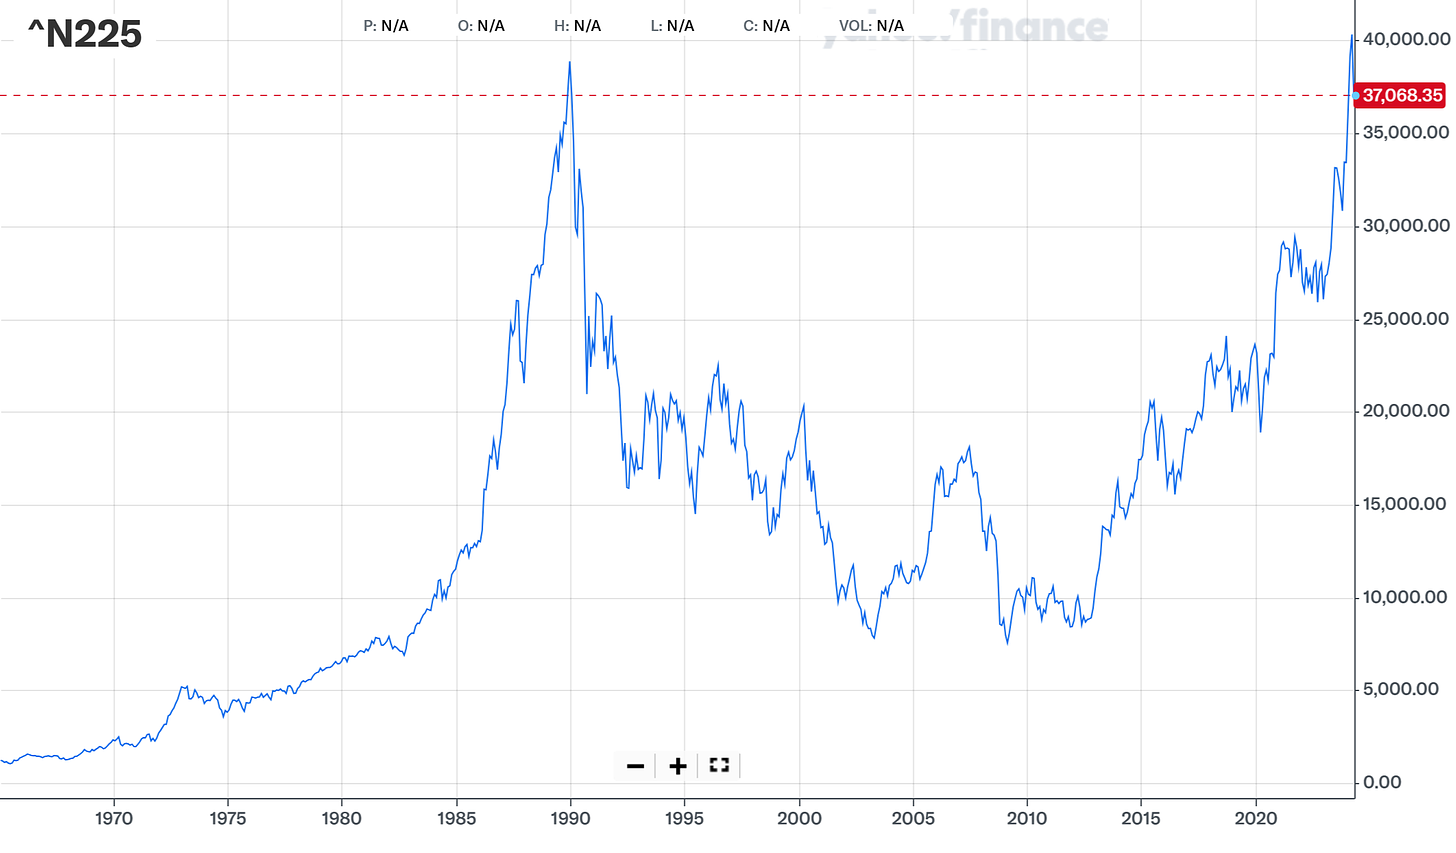
For those who are so inclined, the obvious counter-argument to a “buy and hold” approach is provided by Japan, whose stock market peaked in 1989 and has only just got back to break-even after 35 (thirty five!) years in the wilderness.
Source: Yahoo Finance. Returns are for shown in Japanese Yen for the Nikkei index only and do not include dividends.
1989 was notable for a number of reasons. The Berlin Wall fell. Tiananmen Square. The collapse of Communism. Back To The Future II.
Against this backdrop, Japan was a driving force in terms of economic growth and the global centre of innovation. Japanese cars were a mortal threat to the US automobile industry. The world bought Japanese electronics.
The roaring Japanese economy, combined with a period of relatively easy monetary policy in the mid-80’s, meant that asset prices in Japan went parabolic. Property values became so inflated that the 1.15km square grounds around the Imperial Palace in Tokyo were thought to be worth more than all of the land in the State of California (an area of 423,970 square km).
As bubbles go, this one was a doozy. And when it popped, it led to a couple of lost decades for the Japanese economy and their stock market.
Can you imagine what that does to the investing psychology of a country? When your domestic stock market is underwater for three and a half decades? We can preach patience all we want, but everyone has their limits.
So is this, frankly abysmal, performance evidence that faith in a “buy and hold” approach to investing in equities might be misplaced?
I don’t think so. But there are, for sure, some lessons to learn.
Keep An Eye On Valuation
Back in 1989 the Japanese stock market accounted for just under half of the total global stock market. The obvious comparison to make today is with the US, which currently makes up 63% of the MSCI All Country World Index. The US is unquestionably the dominant economic force in the world, and their stock market includes the biggest and best companies on the planet - much like Japan in the 80’s.
However, just because the US makes up such a large proportion of the global market, this isn’t in and of itself a reason to say that it is over-valued. The US has made up more than half of of the MSCI All County World Index since 2015 and since then has continued to motor ahead quite nicely.
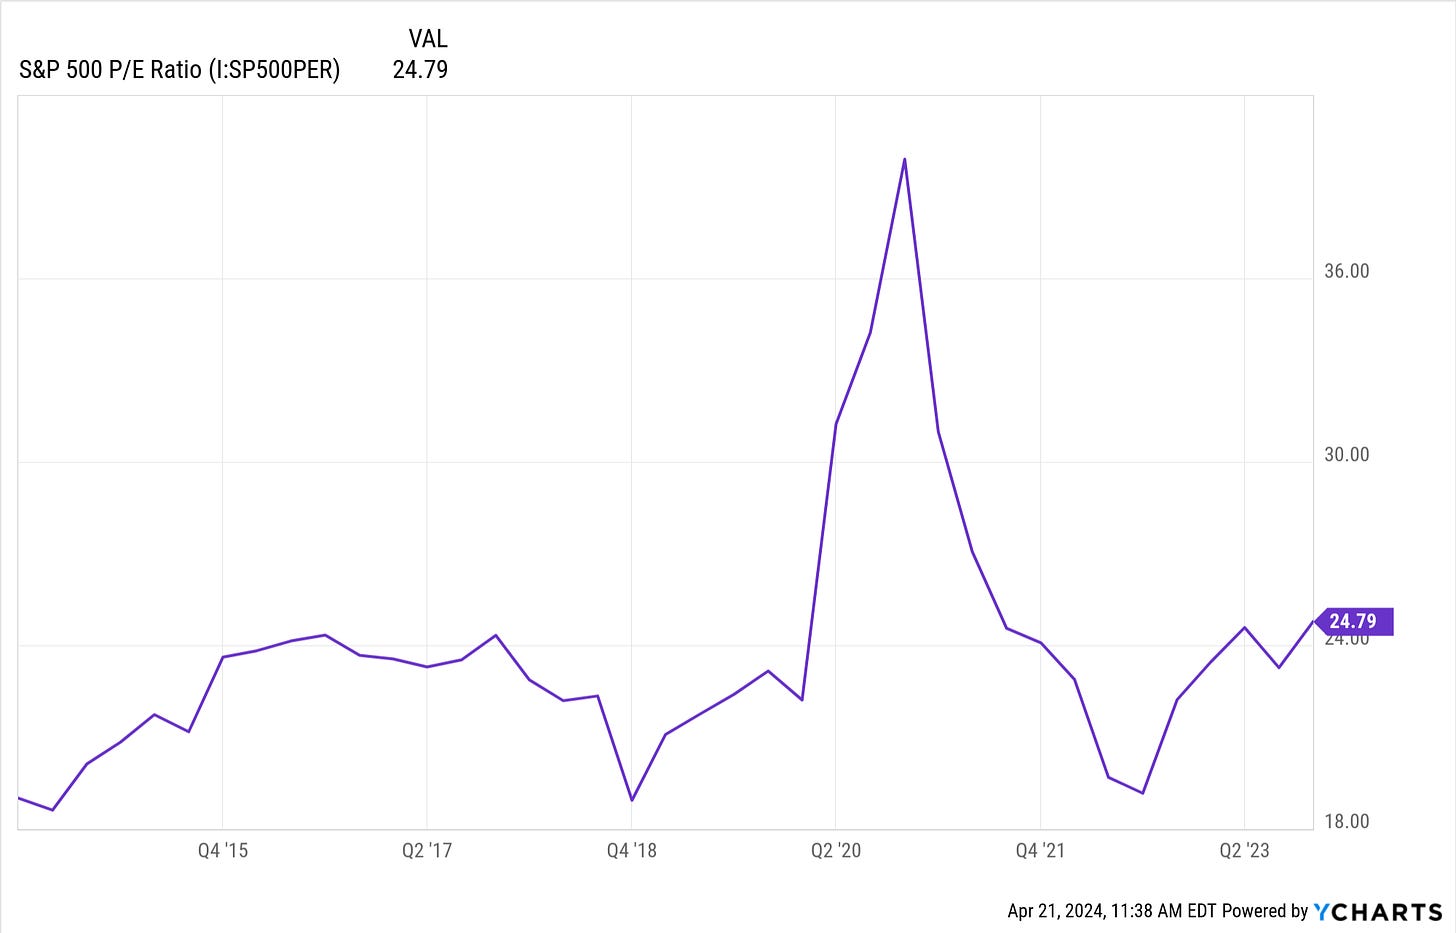
And although the US market does not look cheap by any means, it is nowhere near as expensive as the Japanese market was back in the late 80’s. At its peak in ‘89, the Nikkei traded on over 50 times price to earnings1. The S&P 500 currently trades on just under 25 times earnings, which isn’t ridiculous compared to the last ten years.
Source: Y Charts. The large spike reflects the COVID period, when corporate earnings temporarily collapsed.
Based on the hundred plus years of market data that we have, investing in equities over sensible time frames (five years at a minimum) has generally generated really positive returns. If the past is any guide to the future, when you put money to work over these kinds of timeframes the odds are on your side.
The big exceptions to this rule historically have been in the periods directly following points of extreme over-valuation. The good news is that, by definition, these extreme periods are rare. Japan in 1989 provides us with the classic of the genre.
Don’t Forget Dividends
The eagle eyed amongst you will notice that the returns for the Nikkei shown in the first chart do not include dividends.
It is a quirk of financial reporting that returns for most stock market indices do not include dividends - which is mental really, as you aren’t getting the full picture. Dividends are a key component of overall total returns.
If we include the dividends generated by Japanese companies following 1989, the Nikkei actually reclaimed its ‘89 high in 2017 - seven years earlier than recent media reports would have you believe.
Hardly a result admittedly, but better.
If you don’t need the income that your investments generate, then it is a really good idea to re-invest your dividends. Ideally automatically.2
Buy Global
The third lesson to take from the Japanese debacle is to diversify.
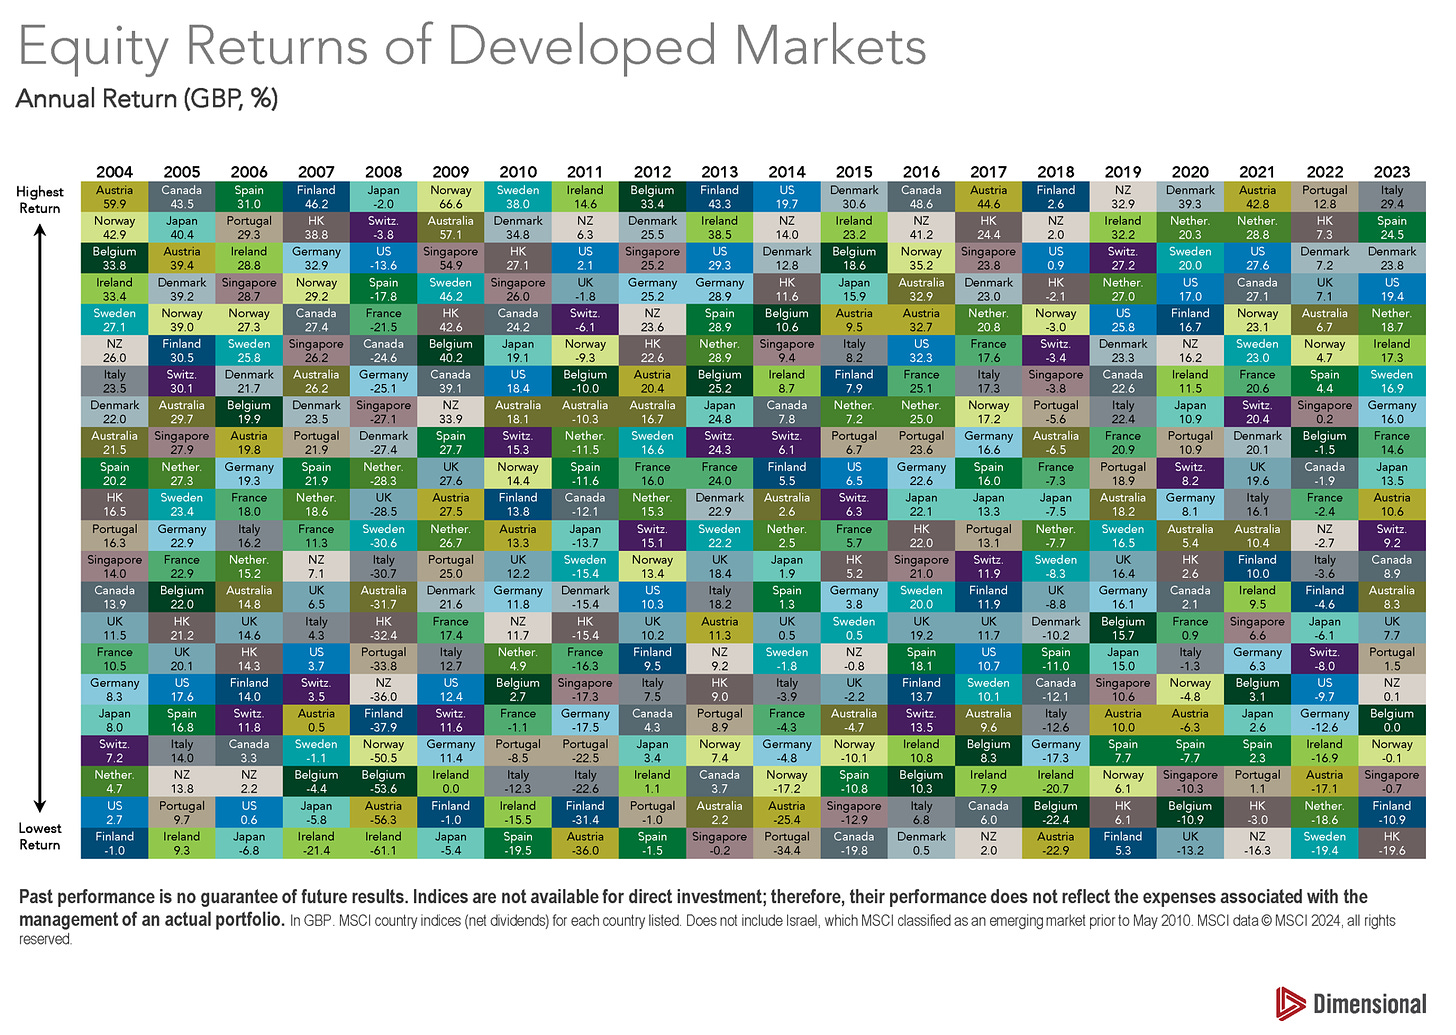
In the same way that many individual stocks go through catastrophic drawdowns (that is to say, they fall away from a high point in terms of share price that they never reclaim), bad things can happen to a given country’s stock market and they can spend very long periods of time underwater. Greece is a recent example. Russia is another obvious one.
It is impossible to know where these blow ups are going to happen in advance, in the same way that it is impossible to know which country’s market is going to do the best in a given year.
Source: Dimensional
You have to have a spread.
Just. Keep. Buying.
The unfortunate soul who chose to invest their savings into the Nikkei in December 1989, and never bought again, obviously had a dreadful investing experience.
But most people don’t invest like this. They invest gradually, over time, as a portion of their income gets saved and invested into their chosen strategy.
Again, hardly ideal, but what this stat does show is the benefit of pound cost averaging.
For those of us who are earning an income, and have surplus left over to invest into capital markets, stock market falls are a Godsend. Until you reach the point where you begin to live off your assets, and particularly when you are young, you should be on your hands and knees begging for lower prices.
As long as equity markets recover their permanent advance by the time you come to live off your assets in retirement, lower prices now mean that you can get the maximum bang for your buck over time.
This is all provided of course that you can stick to the plan. Which is, as ever, the tricky part.
Have a great weekend.
None of the above is intended to constitute advice to any individual. Past performance is no guarantee of future results.
As I have mentioned before, the price to earnings ratio (P/E ratio) is but a simple method of valuing a company’s shares. To calculate the P/E ratio for a stock, you simply divide the share price by the company’s earnings per share.
What this ratio tells us is how enthused investors are by the company’s growth prospects - a high P/E ratio indicates confidence in the company’s future growth prospects and vice versa. P/E ratios for entire markets can be calculated as well, as we have done here.
If you are buying an investment fund, there may be the option to choose either the Income/Distribution (often shortened to Inc or Dis) unit in that fund, or Accumulation (often shortened to Acc) units.
I am generally a fan of buying the Accumulation units, particularly within tax advantaged accounts like pensions or ISAs. When you select the Accumulation units, any dividends generated by the fund are automatically used to buy more units in the fund - adding further momentum to your compounding returns.
This means that you don’t need to remember to re-invest your dividends yourself, it is done for you. And we are always fans of the old automation.


